SCI · Sports Science
The 5-0-5 Change of Direction Test: An Evidence-Based Deep Dive
Reliability, validity, turning mechanics, and practical interpretation of one of the most widely used change-of-direction assessments in team sport, written for integrated medical and performance staffs.
The 5-0-5 is one of the most familiar change-of-direction assessments in team sport, and one of the most frequently misread. It gets called an agility test even though every trial is pre-planned. Total time gets treated as a turning score when a large part of the timed zone is linear running. Reference values get borrowed from studies that used a different approach distance, start condition, surface, or population. Each of those habits produces confident conclusions from numbers that cannot carry them.
This brief pulls the verified evidence into one practitioner resource: how the test is built, what reliability and validity look like in the samples that have actually been studied, what force-plate work shows about the turn, where the test fits in basketball, and where it stops being informative. Where a commonly circulated number could not be traced to a verifiable, protocol-matched source, it has been left out rather than repeated.
01 Test Overview
Draper and Lancaster introduced the 505 in 1985 as a field test of agility in the horizontal plane.1 In its contemporary form it is better described as a planned change-of-direction speed (CODS) test built around a single 180° turn. The athlete accelerates through a timing gate, decelerates, turns at a line marked 5 m beyond the gate, and reaccelerates back through the same gate. The score is the time spent in the 5 m in, 5 m out timed zone.
The label matters. True agility requires perception, anticipation, and decision-making in response to an external stimulus. In a standard 5-0-5 the athlete knows the turn direction and the turn location in advance, so the test does not assess the reactive or perceptual-cognitive demands of sport. Nimphius and colleagues have argued that labelling change-of-direction tests as agility tests is a persistent measurement problem in its own right.2 Treat the 5-0-5 as a measure of a standardized physical task, not of game agility.
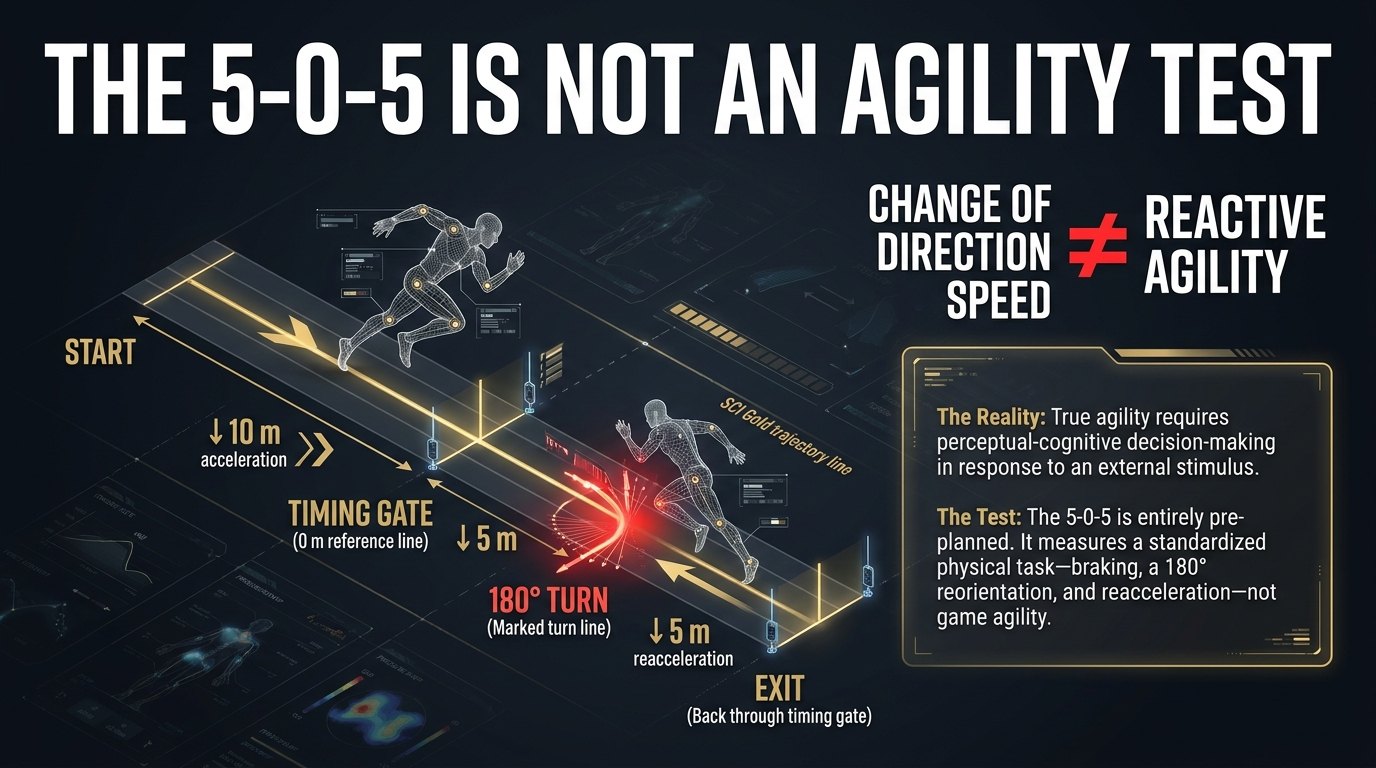
What the Test Standardizes
- Approach: Linear acceleration, or a flying entry into the timed zone
- Deceleration: Braking across the final foot contacts before the turn
- Turn: A 180° reorientation at the turn line
- Reacceleration: Exit velocity back through the gate
- Direction specificity: Right and left turns are separate performances and should be reported separately
Key Interpretation Issue: Linear Sprint Contribution
The timed zone contains 10 m of running, so total time reflects linear capability as well as braking and turning. In 17 cricketers, total 505 time correlated with 10 m sprint time (r = 0.52–0.70), whereas COD Deficit calculated from the same trials did not (r = −0.11 to 0.10), and 5 of the 17 athletes were classified differently for COD ability depending on which metric was used.3 Those values belong to that protocol and that sample. They are not a universal percentage of 5-0-5 time that can be assigned to sprinting.
Where the Test Has Been Studied
| Population | Evidence Used in This Brief |
|---|---|
| Netball (adult female) | Reliability, learning effects, and smallest detectable difference4 |
| Youth football / soccer | Reliability of the 505, modified 505, and COD Deficit; age and maturity effects5–7 |
| Rugby league (adolescent male) | Reliability on an indoor versus outdoor surface8 |
| Cricket | Relationships among 505 time, sprint time, and COD Deficit3 |
| Mixed multidirectional male cohorts | Force-plate and 3D determinants of faster turning9,10 |
| Physically active adults | Reliability and validity of modified 505 metrics11 |
| Basketball (collegiate and NCAA) | Turning kinetics, sub-phase analysis, and asymmetry12–14 |
Breadth of use does not mean reference values transfer between these populations. A time recorded in adult netball players says little about what to expect from an NCAA guard.
02 Standardized Protocol
The conventions below describe a standardized protocol for longitudinal monitoring. They are choices made for internal consistency, not evidence-based thresholds that make a result valid or invalid in an absolute sense. A protocol that is internally consistent and fully documented is more useful than one that copies a published study imperfectly.
| Element | Recommended Standardized Practice |
|---|---|
| Layout | Timing gate at the 0 m reference line; turn line marked 5 m beyond the gate; run-up lane behind the gate |
| Run-up | Traditional 5-0-5: 10 m acceleration before the gate. Modified 5-0-5: shorter approach (commonly 5 m) from a stationary start. Record which variant was used. |
| Timed zone | 5 m in and 5 m out through the same gate |
| Turn criterion | One foot contacts on or beyond the turn line. Apply the same criterion at every session. |
| Trial validity | Discard and repeat trials in which the athlete turns short of the line, uses a hand on the ground for support, or stumbles out of the gate. Write this into your SOP. |
| Direction | Test and report right and left turns separately. Do not average them into a single score. |
| Trials and rest | Multiple trials per direction with full recovery. Fix the rest interval and the trial-selection rule (best trial or mean trial) in advance. |
| Footwear and surface | Same footwear, surface, and cleaning or traction conditions at every session |
| Warm-up | Standardized, documented, and repeated identically |
| Timing gate height | A consistent, documented height selected for the athlete population and timing system |
Familiarization
Learning effects are documented, not theoretical. In 52 female netball players tested weekly for four weeks, repeated-measures analysis showed significant between-session learning effects for both start conditions. Performance stabilized on day 2 for the stationary start and day 3 for the flying start, and the authors recommended one familiarization day for the stationary start and two for the flying start.4 Those recommendations are specific to that protocol and population. Verify stabilization in your own athletes rather than assuming a fixed number of sessions.
Protocol Variations
| Variation | Approach | What Changes for Interpretation |
|---|---|---|
| Traditional 5-0-5 | ~10 m flying run-up into the gate | Higher entry velocity and a larger braking requirement. Total time carries a larger linear-sprint contribution. |
| Modified 5-0-5 | Shorter approach, commonly 5 m, from a stationary start | Lower entry velocity and a smaller sprint contribution. Practical on indoor courts. Produces a different movement strategy, so times are not comparable with the traditional variant. |
| Reactive 5-0-5 | As above, with turn direction cued at the last moment | Adds a perceptual-cognitive demand and moves the task toward agility. Adds variability and needs its own reliability evidence before small changes are interpreted. |
| Sub-phase 5-0-5 | Standard layout with additional gates or a motorised resistance / velocity device | Partitions the task into approach, deceleration, turn, and reacceleration segments. Diagnostically richer, but each added metric carries its own measurement error.13,15,16 |
Common Testing Errors
| Error | Effect on Data | Control |
|---|---|---|
| Turning short of the line | Shortens the braking requirement and flatters the score | Observer at the turn line; discard and repeat |
| Inconsistent gate height or placement | Changes which body segment breaks the beam and shifts times systematically | Fix and record gate height and placement |
| Drifting approach distance | Alters entry velocity, which changes the braking task itself | Mark the start position; record approach distance |
| Averaging right and left | Discards the direction-specific information the test provides | Report each direction separately |
| Mixing best-trial and mean-trial scoring | Introduces change that is purely procedural | Fix the scoring rule in advance |
| Insufficient recovery | Turns a speed test into a partially fatigued one | Fixed, full rest interval between trials |
| Skipping familiarization | Learning effects masquerade as improvement | Confirm performance has stabilized before setting a baseline |
Reporting Requirement
Every 5-0-5 result should travel with its protocol: variant, approach distance, start condition, timing system and gate height, surface, footwear, turn criterion, direction, familiarization completed, rest interval, and trial-selection method. A time without this metadata cannot be interpreted or compared.
03 Reliability
Reliability is not a property of "the 5-0-5." It belongs to a specific protocol, measured in a specific population, with a specific timing setup and amount of familiarization. The test can show acceptable-to-excellent reliability in familiarized athletes, but each value below should be read within the sample and protocol that produced it.
Reliability Findings by Study
| Study | Population | Protocol | Reported Reliability |
|---|---|---|---|
| Barber et al. (2016)4 | 52 female netball players | 505, stationary and flying start; 3 trials each, weekly for 4 weeks | Within-session ICC 0.96–0.97 (stationary) and 0.90–0.97 (flying). Between-session ICC 0.965 (stationary) and 0.951 (flying). Significant learning effects between sessions. |
| Dugdale et al. (2020)7 | 86 youth soccer players, 13.6 ± 2.0 y | Modified 505 plus Y-sprint; 2 sessions 7 days apart | Good reliability across the COD and agility tests for the whole sample (ICC 0.81–0.91; CV 1.2–2.0%). Larger between-session differences in younger and less mature players. |
| Živković et al. (2025)11 | 27 physically active males, 18.8 ± 1.7 y | Modified sprint and COD protocols; sprint, COD, and total time; Limb Symmetry Index | Sprint and COD times ICC > 0.8, CV < 3%; total time ICC > 0.9. Adding a reaction-time element raised CV above 7%. Limb Symmetry Index was the least reliable output (ICC < 0.6). |
| Sammoud et al. (2021)6 | 89 prepubertal male soccer players, 11.7 ± 1.2 y | 505 plus 20 m sprint, retested 1 week apart; COD Deficit from mean times | 505 acceptable (ICC3,1 0.75; typical error < 5%). COD Deficit poor (ICC3,1 0.47; typical error 10.55%), with only marginal sensitivity (typical error 0.12 s vs smallest worthwhile change 0.04 s). |
| Carron & Dalbo (2025)8 | 15 adolescent male rugby league players, 17.1 ± 0.7 y | Weekly testing for 3 weeks on an indoor multipurpose sport surface | Sprint and shuttle-run tests were reliable indoors (CV < 5%; ICC moderate to good). The 5-0-5 was the exception (CV 4.6–5.1%; ICC poor). |
Detecting Real Change
A change in 5-0-5 time is meaningful only if it exceeds the measurement error of your own testing system. In the netball sample, smallest detectable differences were 3.91% for the stationary start and 3.97% for the flying start.4 Use that as a worked example of expected magnitude under one protocol. It is not a threshold to import for youth athletes, basketball players, or a modified 5-0-5. Establish your own typical error, in your own athletes, on your own surface, and report it alongside the score.
Factors That Shift Reliability
| Factor | Effect and Evidence |
|---|---|
| Familiarization | Significant between-session learning in netball players, with performance stabilizing on day 2 (stationary) and day 3 (flying).4 Baselines taken before stabilization will drift. |
| Age and maturity | Between-session differences were larger in younger and less mature youth soccer players, with negative correlations between age and inter-session difference.7 Interpret youth data more conservatively. |
| Derived metrics | Metrics built from two measured quantities inherit both error sources. COD Deficit showed poor relative reliability and marginal sensitivity in prepubertal soccer players.6 Limb Symmetry Index was the least reliable modified-505 output (ICC < 0.6).11 |
| Added reaction element | A reaction-time component raised variability (CV > 7%) while improving ecological validity.11 Reactive variants need their own error estimates. |
| Environment | In adolescent rugby league players, the 5-0-5 was the only test with poor relative reliability on the indoor surface studied, even though the other tests were acceptable in the same sessions.8 |
Surface Considerations
In that rugby league sample, the 5-0-5 showed poor relative reliability indoors, yet the mean differences between indoor and outdoor testing were trivial and non-significant.8 The practical message is to establish reliability on the surface where you actually intend to monitor athletes. It is not evidence that surfaces are categorically non-comparable. Standardize surface, footwear, and timing hardware within your system, and interpret cross-surface comparisons cautiously unless acceptable agreement has been shown for your protocol and population.
04 Validity and COD Deficit
The 5-0-5 has good logical validity for a pre-planned 180° braking-and-turning task. It does not have validity as a measure of agility, multi-angle cutting, or sport-specific multidirectional performance.2
COD Deficit, Stated Accurately
COD Deficit (CODD) is calculated by subtracting a matched linear sprint time from 5-0-5 completion time (CODD = 5-0-5 time − matched sprint time; the cricket study used 10 m sprint time). It estimates the additional time associated with the directional change and may reduce the influence of linear speed. In 17 cricketers, CODD correlated with 505 time (r = 0.74–0.81) but not with sprint time (r = −0.11 to 0.10), and most athletes showed a meaningful difference between their standardized 505 score and their standardized CODD score.3 Interpret CODD alongside total time, and only when both component measures are reliable for your population and protocol.
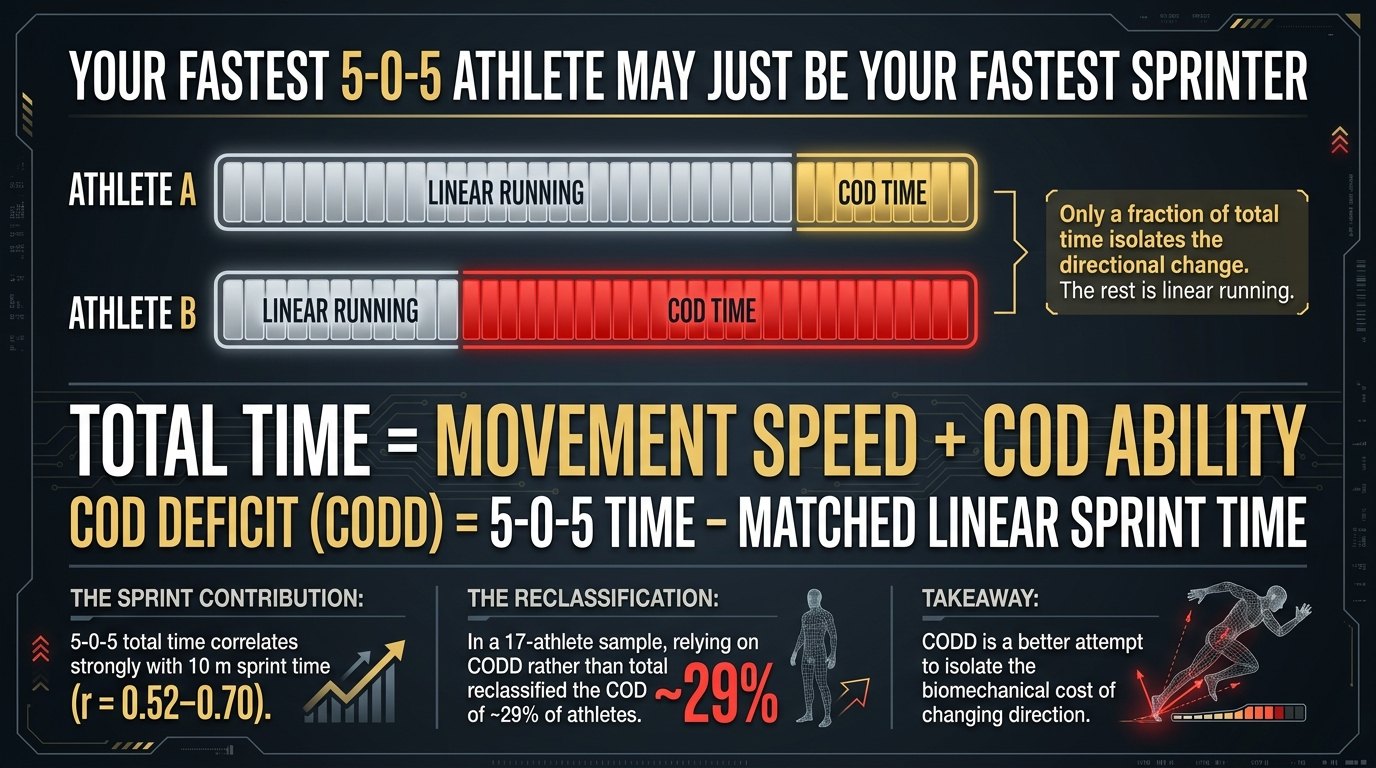
Why COD Deficit Is Not a Pure Measure
- Context-dependent: It remains influenced by protocol, test distance, the sprint measure used, entry velocity, anthropometrics, turning technique, and population.
- Compounded error: It inherits the measurement error of both component tests, so it is less reliable than either one.
- Population limits: In prepubertal male soccer players it showed an ICC of 0.47, a typical error of 10.55%, and only marginal sensitivity, and the authors advised against using it in that population.6
- Split-dependent: Its value depends on which sprint split is subtracted. A deficit computed from a 10 m split is not comparable with one computed from a 20 m split.
- Not a quality score: In adolescent basketball players, CODD related inversely to linear speed at 5, 10, and 20 m (r = −0.55 to −0.46), and faster players showed larger deficits. That study used the pro-agility and zig-zag tests rather than a 5-0-5, but it shows that a deficit value cannot be read in isolation.18
Relation to Other COD Tests
A principal component analysis of nine change-of-direction tests in 76 male and female kinesiology students extracted three components in men and two in women (82.3% and 71.4% of variance explained). The 5-0-5 grouped with the T-test and a 180° turn as comparatively "pure" change-of-direction tasks, separate from multi-turn manoeuvrability tests such as the Illinois, AFL run, and figure-of-eight.19 These families of tests are not substitutes for one another. Choosing the 5-0-5 selects a braking-and-turning task, not a general agility battery.
Relationships with Strength, Power, and Sprint
| Quality Assessed | Sample | Association Reported |
|---|---|---|
| 10 m sprint vs 505 total time | 17 cricketers | r = 0.52–0.703 |
| 10 m sprint vs COD Deficit | 17 cricketers | r = −0.11 to 0.10 (no meaningful relationship)3 |
| Eccentric capability (Nordic hamstring peak torque, CMJ eccentric measures, flywheel squat) | 196 basketball and tennis players | Explained 25.1% of variance in 90° COD and 37.4% in 180° COD20 |
| Unilateral strength (single-leg hop, CMJ, isometric mid-thigh pull, eccentric knee-extensor torque) | 115 adolescent cricket, netball, and basketball athletes | Single-leg hop vs COD speed r = −0.43 to −0.67; CMJ vs COD speed r = −0.38 to −0.69, and more weakly with COD Deficit (r = −0.24 to −0.45)21 |
| Isometric, concentric, and eccentric squat strength | 25 basketball players, 44% female | Concentric strength separated faster from slower players most at 45° (ES ≥ 0.813). Isometric and eccentric strength related moderately to largely with 90° COD (ρ ≥ 0.394); all muscle actions related largely with 180° COD (ρ ≥ 0.445)22 |
| Countermovement jump variants | 21 experienced soccer players | Bilateral vertical and unilateral horizontal jumps predicted total COD-test time but not 505 time23 |
05 Biomechanical Insights
The turn is not a single event. It is a sequence of foot contacts, each with a different mechanical role, and those contributions have been quantified directly during 5-0-5 and modified 5-0-5 trials.
Foot-Contact Roles in the Turn
| Contact | Mechanical Role and Evidence |
|---|---|
| Antepenultimate (APFC), third-last contact | In 20 university male soccer players, the APFC produced greater peak braking forces in shorter ground contact times than the penultimate or final contacts (p ≤ 0.011). Greater APFC braking forces were associated with faster 505 performance (r² = 21.6–54.5%), and the authors concluded the APFC plays a more pivotal role in deceleration than the penultimate contact.24 |
| Penultimate (PFC), second-last contact | Contributes substantially to braking. In 40 multidirectional male athletes, applying a greater proportion of braking force at the penultimate contact relative to the final contact was associated with faster turning.9 In collegiate basketball players, faster performers showed greater PFC braking forces and impulses and longer PFC step length.12 |
| Final (FFC), turning contact | Completes braking and initiates reacceleration. Faster performers showed greater FFC braking and propulsive forces with shorter contact times.12 Greater FFC mean horizontal force was associated with faster 505 time (r² = 38.8%).24 |
| First accelerating (AFC), first contact after the turn | Drives the exit. In basketball players, faster performers generated greater horizontal forces and impulses with shorter contact times and lower vertical impulses.12 |
Basketball Turning Mechanics
Forty collegiate basketball students performed a modified 505 while force-time characteristics were recorded across the penultimate, final, and first accelerating contacts. Faster performers and the higher-playing-level group showed lower completion times, higher approach velocities, longer step lengths in the penultimate and final contacts, and greater braking forces and impulses. Kinetic variables from the final and first accelerating contacts, together with approach velocity, accounted for 75% and 76.2% of completion time depending on whether the first accelerating contact contained a braking component.12
Faster Versus Slower Performers
In 61 male soccer, rugby, and cricket athletes who completed both modified and traditional 505 trials with 3D motion capture and force plates, faster performers showed greater peak and mean horizontal propulsive forces in shorter ground contact times, more horizontally oriented braking and propulsive forces, greater horizontal-to-vertical force ratios, greater approach velocities, and greater velocity reductions across key instants of the turn. They also showed greater penultimate-contact hip and knee flexion and ankle dorsiflexion, greater medial trunk lean, and greater internal pelvic and foot rotation (r or ρ = 0.317–0.795).10 A related analysis of 40 multidirectional male athletes found faster performance associated with shorter ground contact times (r = 0.701–0.757), greater horizontal propulsive forces (r = −0.572 to −0.611), and lower final-contact vertical impact forces (r = 0.449–0.559).9
A systematic review of 13 studies (374 participants, 45–180° tasks) described the same multifactorial picture. Faster times were associated with shorter ground contact time, higher approach and exit velocities, greater braking and propulsive forces, greater trunk inclination, lower centre-of-mass height, and greater hip, knee, and ankle joint moments and power. Findings were inconsistent across studies, 79.4% of participants were male, and every task was pre-planned.25 These are cross-sectional associations describing how faster athletes move. They do not identify a single governing variable, and they do not tell you which variable will respond to training.
Turning Mechanics Are Trainable
A six-week non-randomised intervention in 25 male multidirectional-sport athletes (13 intervention, 12 control) delivered two weekly sessions of change-of-direction speed and technique-modification training. Significant group-by-time interactions emerged for completion time, mean horizontal propulsive force, horizontal-to-vertical braking and propulsive force ratios at the penultimate and final contacts, final-contact peak knee flexion, and penultimate-contact hip flexion. The intervention group improved by small to large magnitudes (g = 0.49–1.21), and performance gains were largely to very largely associated with the mechanical changes (r or ρ = 0.527–0.851).26 This is the most direct evidence that turning technique can be modified, and it is the appropriate basis for coaching turn mechanics. The design limits still apply: non-randomised, small, male only, six weeks.
Angle and Joint Loading
Joint Loading at 180 Degrees
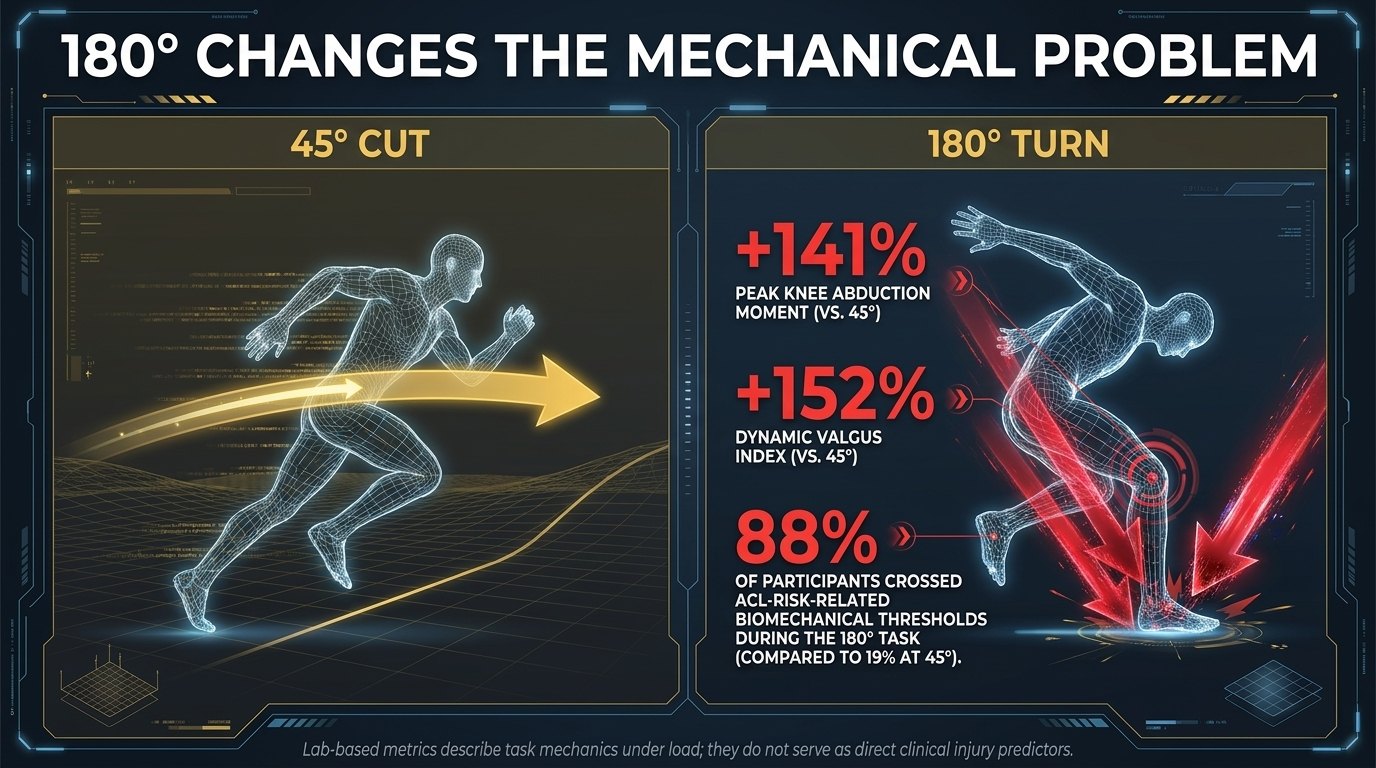
In 26 male soccer players performing 45°, 90°, 135°, and 180° tasks with 3D motion capture, force plates, and EMG, peak knee abduction moment increased by 141% and a dynamic valgus index by 152% from 45° to 180°, with a nonlinear inflection reported at 90°. The proportion of players exceeding the study's ACL risk-related biomechanical thresholds was 88% during 180° tasks compared with 19% at 45°.27
That 88% describes how many of 26 male soccer players crossed thresholds defined within one laboratory study. It is not an injury rate or a clinical screening cut-off, it does not predict who will get hurt, and it is not basketball data. What it does support is that 180° tasks carried higher lower-limb joint loading than shallower cuts in that sample, which is relevant when deciding where a maximal 5-0-5 belongs in a rehabilitation progression.
06 Application to Basketball & Team Sports
180° reversals are relevant to real basketball actions: transition turns, defensive recoveries, closeouts followed by a reversal, and rebounding into a break. The 5-0-5 is therefore a defensible component of a basketball testing battery. It is not a sufficient one.
What the 5-0-5 Does Not Capture in Basketball
- Lateral shuffling: A large share of defensive movement, and mechanically distinct from a 180° turn
- The full angle spectrum: Cuts occur across many angles, and the qualities associated with performance differ by angle22
- Reactive and perceptual-cognitive demand: The standard test is fully pre-planned2
- Ball skill, contact, and opponent interaction
- Fatigue and competition context: The test is a fresh, maximal, isolated effort
Basketball-Specific Evidence
| Study | Sample | Findings Relevant to the 5-0-5 |
|---|---|---|
| Petway et al.13 | 124 male NCAA Power 4 basketball athletes from 10 programs | Modified 505 assessed with a portable motorised resistance device and partitioned into sub-phases. Four phase-specific metrics were associated with total time: time in phase 1a (r = 0.90), time in phase 1b (r = 0.77), maximal acceleration in phase 1a (r = −0.73), and maximal deceleration (r = −0.42). Bigs (n = 54) and guards (n = 70) were compared directly. |
| Wang et al.14 | 42 college basketball players | Significant dominant versus non-dominant asymmetry in the 505 (asymmetry score 2.54 ± 2.28; ES 0.34). 505 asymmetry did not correlate with asymmetry in a lateral-shuffle COD test, and agreement on the direction of asymmetry with single-leg jump tests was poor to slight (kappa −0.07 to 0.22). |
| Santoro et al.12 | 40 collegiate basketball students | Turning-phase kinetics during a modified 505; faster and higher-playing-level performers distinguished by approach velocity, step length, and braking force characteristics. |
| Lazić et al.18 | 38 male adolescent basketball players, 15.5 ± 0.5 y | COD Deficit related inversely to linear speed at 5, 10, and 20 m (r = −0.55 to −0.46), and faster players showed larger deficits. Protocol note: pro-agility and zig-zag tests, not a 5-0-5. |
| Barrera-Domínguez et al.28 | 130 basketball players, 46% female, 23.7 ± 5.3 y | Cluster-derived COD Deficit thresholds were strongly angle-dependent: 3–8% at 45°, 17–25% at 90°, and 43–51% at 180° for the pooled sample. Protocol note: 10 m linear and COD speed tests, not a 5-0-5, so these values do not transfer to 5-0-5 deficits. |
Asymmetry Is Task-Specific
The Wang et al. finding is the practically important one. An athlete's 505 asymmetry said little about their asymmetry on a lateral-shuffle task or on single-leg jumps, including which side was weaker.14 A single 505 asymmetry value is not an athlete-level asymmetry profile.
Protocol-Matched Benchmarking
Compare 5-0-5 performance only against reference data collected with a matched protocol: test variant, timing system, gate setup, surface, footwear, turn criterion, athlete population, and trial-selection method. For longitudinal monitoring, athlete-specific baselines and local measurement error are generally more informative than universal cutoffs.
Generic categorical rating bands for 5-0-5 time (the elite, good, and average tables that circulate widely) could not be traced to a protocol-matched, population-matched published source, so they are not reproduced here.
Return-to-Sport Interpretation
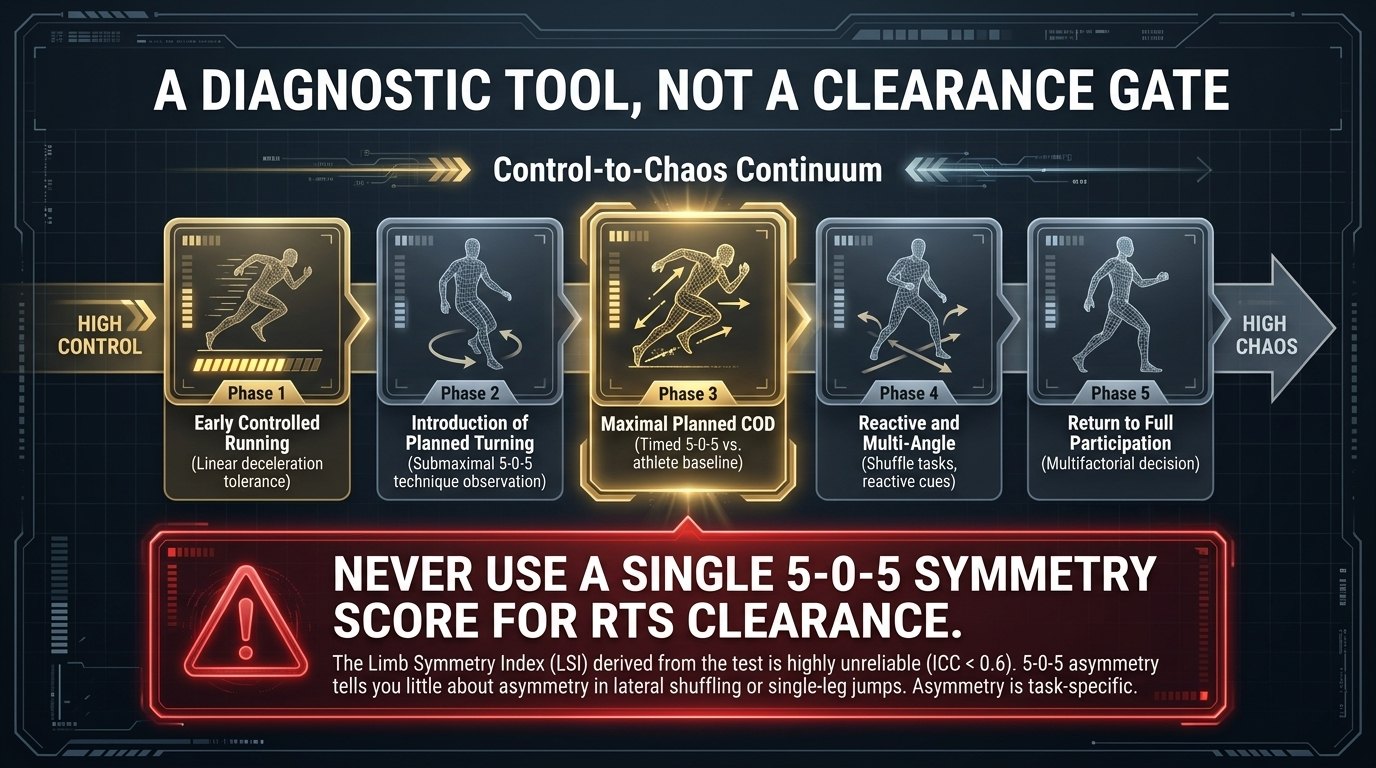
The 5-0-5 can contribute to a multifactorial return-to-sport profile. Interpret total time, directional performance, COD Deficit where reliable, technical quality, progressive exposure tolerance, sprint capacity, multi-angle and reactive COD tasks, sport-specific workload, symptoms, psychological readiness, and clinician and coach judgment together. No single 5-0-5 score, asymmetry value, or limb-symmetry threshold should stand alone as a clearance criterion.
Limb-symmetry thresholds are a weak foundation here for two reasons. The Limb Symmetry Index derived from a modified 505 was the least reliable output in a dedicated reliability and validity analysis (ICC < 0.6), while total time was the most reliable (ICC > 0.9).11 And 505 asymmetry did not agree with asymmetry measured on other tasks, even in direction.14 A threshold applied to an unreliable, task-specific quantity will misclassify athletes. No source was found that validates a 5-0-5 limb-symmetry or COD Deficit asymmetry cutoff for return-to-sport decisions, so none is given here.
07 Interpretation & Programming
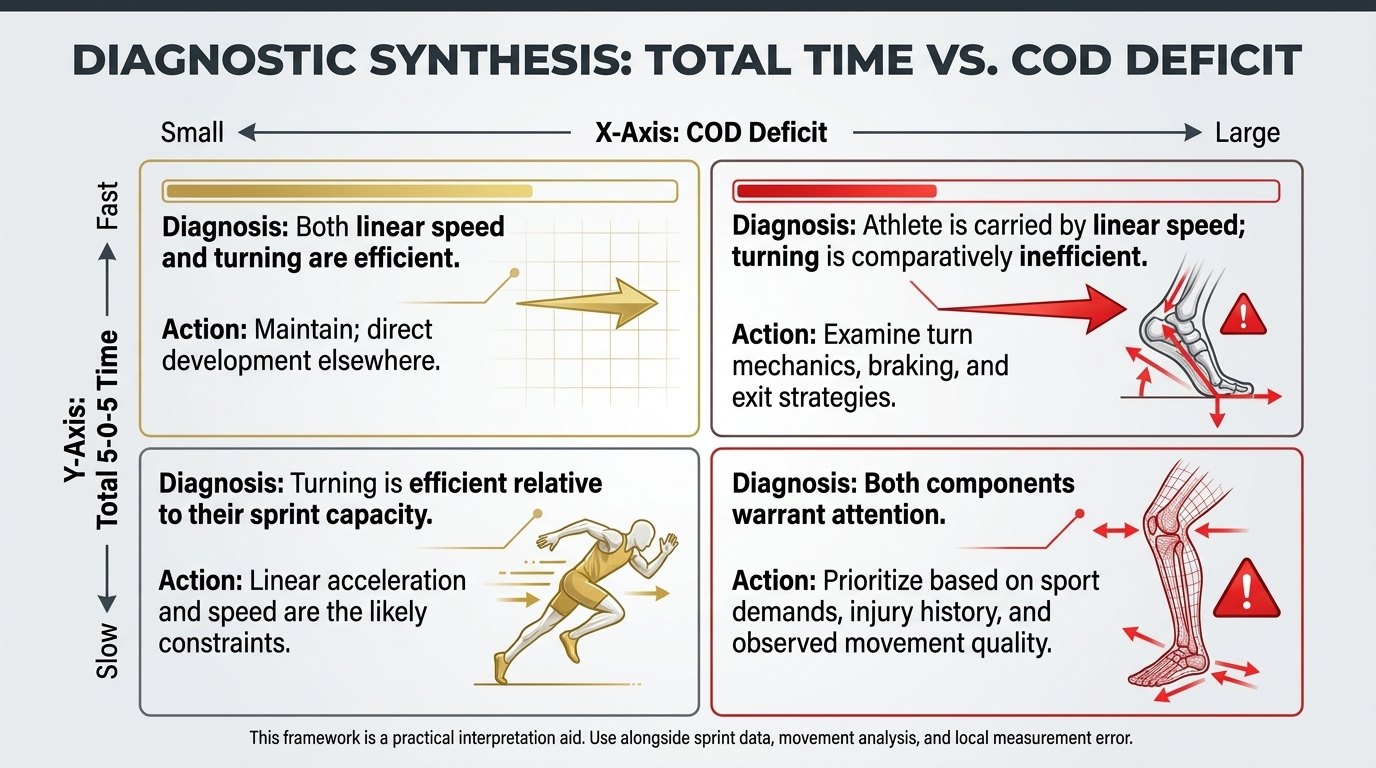
Reading Total Time and COD Deficit Together
The two metrics respond to different capabilities, so reading them together tells you more than reading either alone.3 The grid below is a practical way to organise that reading.
| Total 5-0-5 Time | COD Deficit | Plausible Reading and Next Step |
|---|---|---|
| Fast | Small | Linear speed and turning both appear efficient. Maintain, and direct development elsewhere. |
| Fast | Large | Total time may be carried by linear speed while turning is comparatively inefficient. Examine turn mechanics, braking, and exit before concluding the athlete is a good mover. |
| Slow | Small | Turning appears efficient relative to sprint capacity. Linear acceleration and speed are the more likely constraint. |
| Slow | Large | Both components warrant attention. Prioritise according to sport demands, injury history, and observed movement quality. |
Sub-Phase Analysis
Partitioning the 5-0-5 into sub-phases has been proposed as a way to move from a single score toward locating where time is lost.15,16 In the largest basketball application, four sub-phase metrics from a modified 505 were associated with total completion time in 124 NCAA athletes, led by time in the initial phases and by maximal acceleration and deceleration.13 Sub-phase data can help guide further assessment, but training priorities should stay athlete-specific, and each added metric needs its own reliability evidence before small changes are interpreted. No single phase has verified support as the universal training priority.
Training Approaches with Verified Support
| Approach | Evidence and Appropriate Framing |
|---|---|
| COD technique modification | Six weeks of twice-weekly COD speed and technique-modification training improved turning performance and shifted force-application mechanics in 25 male multidirectional-sport athletes, with performance gains tied to the mechanical changes.26 Non-randomised and small, but directly on-task. |
| Plyometric training | A meta-analysis of 24 studies and 738 youth basketball players (ages 5–17.99) found plyometric training improved jumping, linear sprinting, COD speed, and balance, but not lower-limb strength. COD improvements appeared in the 5–10.99 and 11–14.99 year groups but not the 15–17.99 group, and were significant in male but not female participants.29 |
| Strength training guided by a force-profile input | A five-week in-season programme individualised using the dynamic strength index (DSI) produced significant improvements in sprint and 505 performance in 43 elite basketball players, predominantly in the group directed toward strength work.30 |
| Angle-specific development | The qualities separating faster from slower basketball players changed with cutting angle: concentric strength differentiated most at 45°, while all muscle actions related largely to 180° performance.22 Test and train across the angles the athlete's position actually requires. |
Two cautions on reading this evidence. The plyometric subgroup splits are a reason to individualise, not a template, and no optimal weekly jump count, session frequency, or programme duration is stated here. Program variables should reflect training age, current jump exposure, schedule, strength training, injury history, tissue tolerance, and sport demands. For DSI, the cited trial used a 0.90 cut-point as an allocation variable in one five-week study of 43 players.30 That cut-point is not a validated universal diagnosis, and athletes on either side of it should not be labelled as categorically lacking strength or ballistic capability. DSI works best as one input into an individualized strength-power profile alongside absolute force, jump performance, training history, and sport demands.
Structuring On-Court Progression
The control-chaos continuum, originally developed for on-pitch rehabilitation in elite football, has been adapted to elite basketball as a five-phase framework that progresses from high control (a return to on-court running) to high chaos (unrestricted live basketball). The adaptation emphasises qualitative aspects of performance such as skill, sport-specific movement, contact, and decision-making, given how hard load is to quantify in basketball, and positions strength and power diagnostics as inputs across the continuum rather than as gates.31
A 5-0-5 fits naturally in the more controlled phases as a closed, planned, measurable task. As progression moves toward chaos, its informational value declines relative to reactive, multi-angle, contact, and decision-based tasks, which is exactly why it cannot serve as the final clearance test.
| Stage | What the 5-0-5 Contributes |
|---|---|
| Early controlled running | Not yet appropriate. Establish linear deceleration tolerance and submaximal turning first. |
| Introduction of planned turning | Submaximal, technique-focused 5-0-5 repetitions with movement-quality observation. Do not time for comparison yet. |
| Maximal planned COD | Timed 5-0-5 in both directions, compared against the athlete's own pre-injury baseline and your local measurement error rather than a published norm. |
| Reactive and multi-angle | Reactive variants, multiple cutting angles, shuffle tasks, and sport-specific drills become the primary information source. |
| Return to full participation | Multifactorial decision. The 5-0-5 is one input among capacity, movement quality, exposure tolerance, symptoms, psychological readiness, and clinician and coach judgment. |
08 Limitations & Considerations
What the 505 Does Not Measure
| Gap | Explanation |
|---|---|
| Agility | The standard protocol is fully pre-planned and excludes perception, anticipation, and decision-making.2 |
| Turning in isolation | A substantial part of the timed zone is linear running, so fast total time can reflect sprint capacity rather than turning efficiency.3 The size of that contribution is protocol-specific and should be established for your own protocol rather than imported as a fixed percentage. |
| Other angles | A 180° turn does not represent the angle spectrum of team sport, and the qualities associated with performance differ across angles.22,27,28 |
| Other movement patterns | No shuffling, backpedalling, ball, contact, or opponent |
| Fatigue | A fresh, maximal effort says nothing about performance under match fatigue |
Measurement Limitations
- Protocol sensitivity: Approach distance, start condition, gate height and placement, turn criterion, surface, and footwear all shift times. Cross-study and cross-programme comparison is unsafe without matched protocols.
- Learning effects: Significant between-session learning has been documented, with stabilization only after the second or third session depending on start condition.4
- Population dependence: Reliability was poorer in younger and less mature youth athletes,7 and the test showed poor relative reliability on one indoor surface in adolescent rugby league players.8
- Derived metrics are weaker: COD Deficit showed poor relative reliability and marginal sensitivity in prepubertal male soccer players,6 and Limb Symmetry Index was the least reliable output in a modified-505 analysis (ICC < 0.6).11
- Asymmetry is task-specific: 505 asymmetry did not correlate with lateral-shuffle asymmetry and agreed poorly with single-leg jump asymmetry, even in direction.14
Evidence-Base Limitations
- Small samples: Several of the most-cited biomechanical analyses involve 17 to 61 participants.3,9,10,24
- Male-dominated and pre-planned: In a systematic review of biomechanical determinants, 79.4% of participants were male, every included task was pre-planned, and moderating factors were minimally examined.25
- Sport transfer is assumed: Much of the mechanical evidence comes from soccer, rugby, cricket, netball, and mixed cohorts. Values from those samples should not be treated as basketball reference data.
- Laboratory loading is not injury prediction: Joint-loading and threshold-prevalence findings describe task mechanics in the sample studied and do not establish injury risk in individuals.27
09 Key Takeaways
SCI Summary for Practitioners
- The 5-0-5 is a planned 180° change-of-direction speed test, not an agility test. It does not capture reactive, perceptual-cognitive, or multi-angle demands.
- It standardizes a combination of approach sprinting, braking, turning, and reacceleration.
- Total time is influenced by linear sprint capacity. A fast total time does not automatically indicate efficient turning.
- Traditional and modified protocols are not interchangeable. Do not pool them or benchmark one against the other.
- COD Deficit can complement total time, but it is not a pure measure of COD ability and should be interpreted only when its component measures are reliable in your population.
- Reliability depends on protocol, population, familiarization, timing setup, surface, footwear, and trial-selection rules. Establish local measurement error before interpreting small changes.
- Faster turning is associated with earlier and more horizontally oriented braking, shorter contacts, and greater horizontal propulsive force, and technique-modification training has changed these mechanics.
- Eccentric, isometric, concentric, and reactive-strength qualities all relate to 180° COD performance, and their relative contribution shifts with angle, approach velocity, and athlete characteristics.
- 180° tasks carried higher lower-limb joint loading than shallow cuts in laboratory samples, but those thresholds are not injury predictions or screening cut-offs.
- In basketball, supplement the 5-0-5 with lateral shuffle, multi-angle, and reactive tasks. It does not capture ball handling, contact, or fatigue.
- Use protocol-matched reference data and athlete-specific baselines rather than universal time cutoffs.
- In rehabilitation, use the 5-0-5 as one input in a multifactorial progression, not as a stand-alone clearance test built on a single time or symmetry threshold.
References
- Draper JA, Lancaster MG. The 505 test: a test for agility in the horizontal plane. Aust J Sci Med Sport. 1985;17:15-18. Pre-digital source; volume and pagination as given in the citation record. Record
- Nimphius S, Callaghan SJ, Bezodis NE, Lockie RG. Change of direction and agility tests: challenging our current measures of performance. Strength Cond J. 2018;40(1):26-38. Publisher
- Nimphius S, Callaghan SJ, Spiteri T, Lockie RG. Change of direction deficit: a more isolated measure of change of direction performance than total 505 time. J Strength Cond Res. 2016;30(11):3024-3032. PubMed
- Barber OR, Thomas C, Jones PA, McMahon JJ, Comfort P. Reliability of the 505 change-of-direction test in netball players. Int J Sports Physiol Perform. 2016;11(3):377-380. PubMed
- Taylor JM, Cunningham L, Hood P, Thorne B, Irvin G, Weston M. The reliability of a modified 505 test and change-of-direction deficit time in elite youth football players. Sci Med Footb. 2019;3(2):157-162. Publisher
- Sammoud S, Bouguezzi R, Negra Y, Chaabene H. The reliability and sensitivity of change of direction deficit and its association with linear sprint speed in prepubertal male soccer players. J Funct Morphol Kinesiol. 2021;6(2):41. Publisher
- Dugdale JH, Sanders D, Hunter AM. Reliability of change of direction and agility assessments in youth soccer players. Sports (Basel). 2020;8(4):51. PubMed
- Carron MA, Dalbo VJ. Run-based tests performed on an indoor and outdoor surface are comparable in adolescent rugby league players. Sports (Basel). 2025;13(10):351. PubMed
- Dos’Santos T, Thomas C, Jones PA, Comfort P. Mechanical determinants of faster change of direction speed performance in male athletes. J Strength Cond Res. 2017;31(3):696-705. PubMed
- Dos’Santos T, McBurnie A, Thomas C, Comfort P, Jones PA. Biomechanical determinants of the modified and traditional 505 change of direction speed test. J Strength Cond Res. 2020;34(5):1285-1296. PubMed
- Živković A, Marković S, Cuk I, Knežević OM, Mirkov DM. Reliability and validity of key performance metrics of modified 505 test. Life (Basel). 2025;15(2):198. PMC
- Santoro E, Tessitore A, Liu C, et al. The biomechanical characterization of the turning phase during a 180° change of direction. Int J Environ Res Public Health. 2021;18(11):5519. Publisher
- Petway AJ, Harper D, Cohen D, Eriksrud O. Factors differentiating change of direction performance in NCAA Power 4 male basketball athletes. Int J Sports Sci Coach. 2026;21(1):321-328. Published online July 17, 2025. Publisher
- Wang P, Lyu M, Geng N, et al. Asymmetry in college basketball players: change of direction performance in shuffle movement and 505 test. Front Physiol. 2025;16:1587719. Publisher
- Ryan C, Uthoff A, McKenzie C, Cronin J. Profiling change of direction ability using sub-phase 5-0-5 analysis. Int J Strength Cond. 2022;2(1). Journal page
- Ryan C, et al. Sub-phase analysis of the modified 5-0-5 test for better change of direction diagnostics. J Sport Exerc Sci. 2022;6(1). Full text
- Ryan C, Uthoff A, McKenzie C, Cronin J. New perspectives of the traditional and modified 5-0-5 change of direction test. Strength Cond J. 2023;45(1):83-92. Publisher
- Lazić A, Andrašić S, Stanković M, Milanović Z, Trajković N. Change of direction deficit: a promising method to measure a change of direction ability in adolescent basketball players. J Hum Kinet. 2022;85:1-11. PubMed
- Kozinc Ž, Šarabon N. Different change of direction tests assess different physical ability parameters: principal component analysis of nine change of direction tests. Int J Sports Sci Coach. 2022;17(5):1137-1146. Publisher
- Smajla D, Kozinc Ž, Šarabon N. Associations between lower limb eccentric muscle capability and change of direction speed in basketball and tennis players. PeerJ. 2022;10:e13439. PMC
- Thomas C, Dos’Santos T, Comfort P, Jones PA. Relationships between unilateral muscle strength qualities and change of direction in adolescent team-sport athletes. Sports (Basel). 2018;6(3):83. PubMed
- Barrera-Domínguez FJ, Del-Cuerpo I, Riego-Ruiz A, Martínez-García D, Jerez-Mayorga D, Chirosa-Ríos LJ, Molina-López J. Strength characteristics in faster change of direction basketball players: a comparison across cutting angles. Eur J Sport Sci. 2024;24(9):1260-1269. PubMed
- Nygaard Falch H, Guldteig Rædergård H, Van den Tillaar R. Relationship of performance measures and muscle activity between a 180° change of direction task and different countermovement jumps. Sports (Basel). 2020;8(4):47. PMC
- Dos’Santos T, Thomas C, Jones PA. How early should you brake during a 180° turn? A kinetic comparison of the antepenultimate, penultimate, and final foot contacts during a 505 change of direction speed test. J Sports Sci. 2021;39(4):395-405. PubMed
- Singh U, Leicht AS, Connor JD, Brice SM, Alves A, Doma K. Biomechanical determinants of change of direction performance: a systematic review. Sports Med. 2025;55(9):2207-2224. Publisher
- Dos’Santos T, Thomas C, McBurnie A, Comfort P, Jones PA. Change of direction speed and technique modification training improves 180° turning performance, kinetics, and kinematics. Sports (Basel). 2021;9(6):73. PubMed
- Li J, Qian H. Biomechanical effects of different change of direction angles on lower limb joint load and injury risk in soccer players. Sci Rep. 2025;15:45123. Publisher
- Barrera-Domínguez FJ, Jones PA, Almagro BJ, Molina-López J. Determination of change of direction deficit thresholds across a spectrum of angles in basketball players. J Sports Sci. 2024;42(7):621-628. PubMed
- Zhou J, Wang X, Hao L, Ran X, Wei W. Meta-analysis of the effect of plyometric training on the athletic performance of youth basketball players. Front Physiol. 2024;15:1427291. Publisher
- Pleša J, Ujaković F, Ribič A, Bishop C, Šarabon N, Kozinc Ž. Effectiveness of an individualized training based on dynamic strength index on sprinting, jumping and change of direction performance in basketball players: a randomized controlled trial. J Sports Sci Med. 2024;23:504-514. PubMed
- Taberner M, Spencer N, Murphy B, Antflick J, Cohen DD. Progressing on-court rehabilitation after injury: the control-chaos continuum adapted to basketball. J Orthop Sports Phys Ther. 2023;53(9):498-509. Publisher